White Paper: The GICS Industrials Sector

May 12, 2026

The GICS Industrials Sector:  Structure, Scope, and Opportunity Set


Download PDF Version

Executive Summary


The Industrials sector, as defined by the Global Industry Classification Standard (GICS), represents one of the broadest and most diversified opportunity sets available to equity investors. The MSCI World Industrials Index captures 257 large- and mid-cap constituents across 23 developed market countries, representing approximately $9.4tn in total market capitalization as of March 31, 2026. The Industrials sector spans 3 industry groups, 14 industries, and >20 sub-industries. This white paper provides an overview of the Industrials sector using the MSCI World Industrials Index as the primary lens, along with the Global Industry Classification Standard (GICS).Sub-Industry Composition


The three GICS Industrial industry groups include 1.) Capital Goods (Aerospace & Defense, Building Products, Construction & Engineering, Electrical Equipment, Industrial Conglomerates, Machinery, Trading & Distributors), 2.) Professional Services (Commercial Services & Supplies and Professional Services), and 3.) Transportation (Air Freight & Logistics, Airlines, Marine, Road & Rail, and Transportation Infrastructure). The breadth of the sector is evident in its sub-industry composition. Aerospace & Defense is the largest sub-industry, representing 22.32% of the index. However, no other single sub-industry exceeds 10%, and the bottom tier (i.e., "Other") collectively accounts for 15.80%.

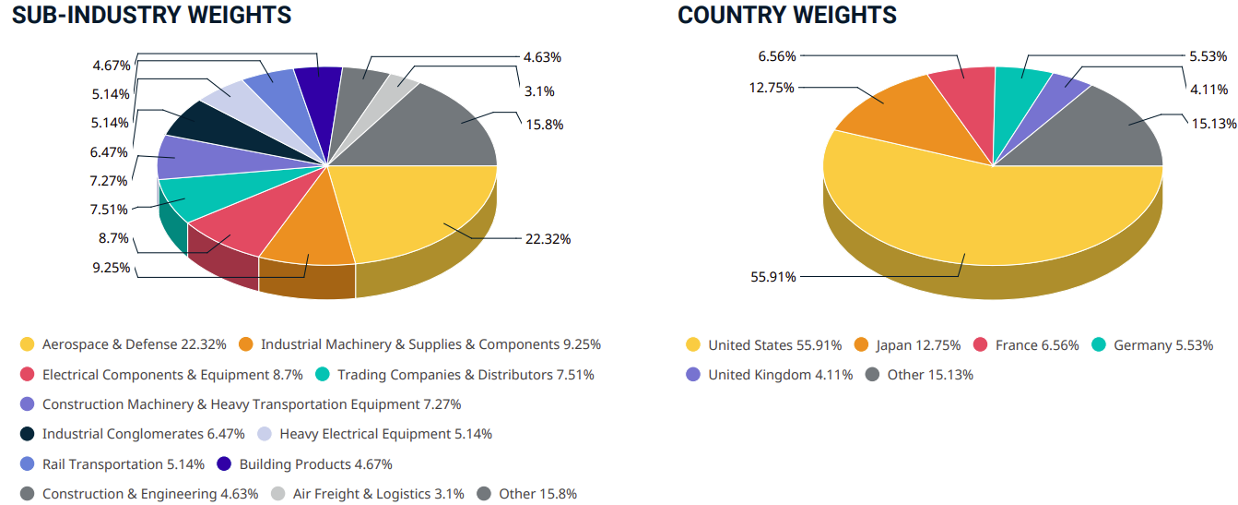
Source: MSCI World Industrials Index


Benchmark Weightings as of 3/31/26


The Industrials sector commands meaningful weight across the two most widely used value benchmarks in the United States. At 16.02% of the Russell 1000 Value Index and 12.40% of the Russell 2000 Value Index, Industrials represents one of the largest sector allocations that active value managers must contend with. For managers benchmarked to either index, the sector's breadth across sub-industries means that stock selection within Industrials can be a significant source of alpha generation. Whether an active manager is overweight Aerospace & Defense names at the large-cap level or finding mispriced small-cap Machinery companies, the depth of the sectors’ opportunity set offers a wide canvas for differentiated positioning relative to the benchmark.


Cyclical vs Secular


The Industrials sector has historically been viewed as a collection of largely cyclical end markets, with less secular-driven growth compared to other GICS sectors. The cyclicality of the sector comprises most of the sub-industries, but the growing divergence in end-market drivers across those sub-industries means that not all Industrials names will move in lockstep with the economic cycle, creating meaningful opportunities for active managers to differentiate. Several secular themes are driving sustained demand across the sector's sub-industries, including the buildout of datacenter and AI infrastructure, the reindustrialization and reshoring of domestic manufacturing capacity, the adoption of automation and robotics across production environments, and the expansion and modernization of power generation assets to meet rising electrification needs. 


The convergence of these structural tailwinds with the sector's inherent cyclicality means that Industrials can offer investors both a way to participate in economic recoveries and a vehicle for accessing multi-year capital investment cycles that may be less sensitive to short-term GDP fluctuations than the sector's historical reputation would suggest. 


Calculating Mid-Cycle Earnings


For cyclical Industrials companies, revenue and margins can swing meaningfully, which makes establishing a credible estimate of mid-cycle earnings power essential. This requires rigorous bottom-up fundamental analysis through a detailed examination of a company's revenue composition, its historical margin behavior across prior cycles, and the sustainability of operational or pricing improvements that may have structurally shifted the business's normalized earnings trajectory (see our 80/20 white paper here). Without this level of due diligence, investors risk overpaying for businesses that appear inexpensive on peak earnings, or dismissing under-earning businesses at trough multiples (i.e., artificially high).


Conclusion 


The Industrials sector is one of the most expansive and varied corners of the global equity market, offering investors access to a diverse set of end markets. The sector ranges from Aerospace & Defense to Professional Consulting industries. Its considerable weight in both the Russell 1000 Value and Russell 2000 Value Indices makes it a sector that active managers cannot afford to overlook, as even modest over- or underweights can materially impact relative performance. 


What makes the current environment particularly interesting is that the sector is no longer defined solely by its sensitivity to the economic cycle. A new generation of capital investment themes around electrification, AI-related infrastructure, and supply chain localization is creating pockets of demand that may persist independent of GDP growth. That said, much of the sector remains tied to cyclical dynamics, which means the ability to distinguish between companies benefiting from structural change and those simply riding a cyclical upswing is critical. Getting that distinction right ultimately comes down to fundamental research. For example, understanding where a business sits in its earnings cycle, what a normalized level of profitability looks like, and whether recent margin gains reflect lasting operational improvement or temporary tailwinds remains of high importance.


At Oliver Luxxe Assets, our approach to investing is grounded in deep, bottom-up fundamental research, where we seek to identify high-quality businesses that offer a compelling combination of durable growth and reasonable valuations. Central to our process and discipline is a focus on return on invested capital (see our ROIC white paper here), which we view as an indicator of a management team's ability to allocate capital effectively and create long-term shareholder value. We favor companies that maintain clean, conservatively managed balance sheets that provide financial flexibility to invest through cycles and resilience during periods of economic uncertainty. Equally important is the quality of a company's reinvestment runway. We look for businesses with identifiable and attractive opportunities to deploy capital back into the business at returns that exceed their weighted average cost of capital, whether through organic growth initiatives, capacity expansion, or disciplined acquisitions. 


Prepared by:

Drew R. Crawford Jr.

Director of Equity Research & Senior Research Analyst 


Disclosures: This document contains forward-looking statements relating to the opportunities, and the future performance of the U.S. market generally. Forward-looking statements may be identified by the use of such words as “believe,” “should,” “planned,” “potential” and other similar terms. Examples of forward-looking statements include results of operations and success or lack of success of any particular investment strategy. All are subject to various factors, including, the general and local economic conditions, changing levels of competition within certain industries and markets, changes in interest rates, changes in legislation or regulation, and other economic, competitive, regulatory and technological factors affecting a portfolio’s operations that could cause actual results to differ materially from projected results. Such statements are forward-looking in nature and involve a number of known and unknown risks, uncertainties and other factors, and accordingly, actual results may differ materially from those reflected or contemplated in such forward-looking statements. Prospective investors are cautioned not to place undue reliance on any forward-looking statements or examples. None of Oliver Luxxe or any of its affiliates or principals, nor any other individual or entity assumes any obligation to update any forward-looking statements as a result of new information, subsequent events or any other circumstances. All statements made herein speak only as of the date that they were made.


Disclaimer:

Investments in securities entail risk and are not suitable for all investors. This is not a recommendation nor an offer to sell (or solicitation of an offer to buy) securities in the United States or in any other jurisdiction. All investment strategies have the potential for profit or loss; changes in investment strategies may materially alter the performance and results of a portfolio. Different types of investments involve varying degrees of risk, and there can be no assurance that any specific investment will be suitable or profitable for a client’s investment portfolio.

This document may contain forward-looking statements relating to the objectives, opportunities, and the future performance of the US market generally. Forward-looking statements may be identified by the use of such words as; “believe,” “expect,” and other similar terms. Examples of forward-looking statements include, but are not limited to, estimates with respect to the success or lack of success of any particular investment strategy. All are subject to various factors, including, to general and local economic conditions, changes in interest rates, changes in legislation or regulation, and other economic, competitive, governmental, and technological factors affecting a portfolio’s operations that could cause actual results to differ materially from projected results. Such statements are forward-looking in nature and involve a number of known and unknown risks, uncertainties and other factors, and accordingly, actual results may differ materially from those reflected or contemplated in such forward-looking statements. Prospective investors are cautioned not to place undue reliance on any forward-looking statements or examples. None of Oliver Luxxe or any of its affiliates or principals nor any other individual or entity assumes any obligation to update any forward-looking statements as a result of new information, subsequent events or any other circumstances. All statements made herein speak only as of the date that they were made.

April 15, 2026
“Those who have knowledge don’t predict. Those who predict don’t have knowledge.” - Lao Tzu The first quarter of 2026 proved to be a turbulent period for financial markets. What began as a muted but broadly resilient market environment was upended in late February by the launch of Operation “Epic Fury”. The resulting energy supply shock and repricing of Federal Reserve rate expectations both led to meaningful cross-asset volatility. Major U.S. equity indices finished the quarter mostly lower. Prior to the outbreak of conflict with Iran on February 28th, markets were broadly positive, as the Russell 2000 was up +6.20%, the S&P 500 had gained +0.67%, and the Nasdaq was down -1.33%. The subsequent escalation reversed those moves and weighed on returns through quarter-end, with the S&P 500 finishing down -4.63%, the Dow down -3.58%, and the Nasdaq declining -7.11%. The notable exception was the Small-Cap Russell 2000, which edged higher by +0.58%. The Federal Reserve entered 2026 with a policy rate in the range of 3.50% to 3.75%, having cut rates a cumulative 175 basis points since September 2024. As recently as late February, bond markets were still pricing in more than 50 basis points of additional easing before year-end 2026. That expectation was reduced by quarter’s end, driven by a combination of potentially higher inflation, a geopolitically induced energy shock, and growing concern that the Fed’s hands were tied by competing pressures on its dual mandate.
January 8, 2026
The fourth quarter of 2025 capped off a resilient year for U.S. equities, with major indices posting positive returns amid moderating economic growth, persistent inflation pressures, and a cautious Federal Reserve. The S&P 500 advanced approximately 2.7% in Q4, contributing to a full-year gain of around 18%, driven largely by technology, AI, and communication services sectors. This represents the third consecutive year of double-digit gains. Despite headwinds from policy uncertainty and a projected economic slowdown, markets climbed a "wall of worry," with investors rebalancing portfolios and corporate optimism supporting rallies. Key risks heading into 2026 include potential policy shifts, below-trend GDP growth, and inflation drifting above the Fed's target. As we enter 2026, we believe the global economy should transition to a period of improved economic stability as the path of global trade become clearer. We believe the US equity market should experience measured progress amid a resilient yet evolving economic landscape. In 2026, US equity returns should be driven by fundamentals, particularly earnings growth, rather than further valuation multiple expansion, as current multiples are already above long-term averages. Importantly, corporate profit margins are set to improve in 2026, as companies benefit from operational efficiencies, AI productivity gains (albeit on low adoption rates), and moderating input costs. Additionally, financial conditions are expected to become easier than in early 2025 (see charts below).
October 14, 2025
Discover how the 80/20 Business System helps companies boost efficiency, profitability, and ROIC through strategic resource optimization.
July 2, 2025
Get Comfortable Being Uncomfortable The second quarter of 2025 was a volatile period for global equity markets, reflecting significant uncertainty driven by the implementation of “Liberation Day” tariffs, mixed economic data, and weakening consumer sentiment. The S&P 500 ended the quarter with a modest positive YTD gain, recovering from the -18.9% decline from its February peak, triggered by the introduction of tariffs in April. Despite the market recovering from steep sell-offs, key economic data the Federal Reserve tracks have started to slow. The US labor market has remained resilient, as April’s jobs report added 177,000 nonfarm payrolls, surpassing estimates of 150,000. The unemployment rate moved up to 4.2% from 4.1% in March and wage growth moderated to +3.8% Y/Y growth, aligning with the Federal Reserve’s target of stable inflation. The labor market data has shown that companies have cut back on hiring but are not laying off workers at a material rate. As illustrated below, the monthly Job Openings and Labor Turnover Survey (JOLTS) has shown openings slowing and it has become harder for unemployed workers to find a new job .
April 22, 2025
Looking for Mispriced Opportunities in a Chaotic Market The global equity markets have recently experienced a significant period of volatility, shaped by a mix of macroeconomic developments and policy shifts. The sell-off in the S&P 500 was driven mostly by tariff-related concerns, though it managed a partial recovery toward the end of the quarter. Concerns around economic growth intensified, fueled by softer economic data and uncertainty surrounding the broader “Trump 2.0” policy framework. Survey data reflected this caution, as the March Michigan Consumer Sentiment Index fell to its lowest since November 2022, with one-year inflation expectations rising to 5% and five-year expectations hitting a 32-year high of 4.1%. The March Consumer Confidence Index also dropped to its lowest since January 2021, with the expectation component reaching a 12-year low. Manufacturing PMI swung back into contraction, with cost pressure rising at the sharpest pace in 23 months. All in, the S&P 500 declined -4.59% in 1Q25, which marked its weakest performance since 3Q22. The best-performing sectors were Energy (+9.30%), Healthcare (+6.08%) and Consumer Staples. Conversely, sectors that underperformed were Industrials (0.53%), Communication Services (-6.41%), and Technology (-12.79%). High single-stock concentration levels in the S&P 500 Index, Deep Seek Artificial Intelligence developments, and elevated valuation multiples resulted in the Magnificent Seven stocks underperforming the broader market. In fact, the Magnificent Seven collectively fell into bear market territory, as the group declined -15% during 1Q25 and is now down -20% since the peak in December 2024.
March 3, 2025
White Paper: The Importance of Reinvestment Opportunities in Driving Intrinsic Value Executive Summary At Oliver Luxxe, we believe that the intrinsic value of an asset stems from its ability to generate sustainable cash flows over time, discounted at an appropriate required rate of return. Central to this valuation framework are three key drivers: return on invested capital (ROIC) , reinvestment opportunities , and the quality and sustainability of earnings . Through our proprietary quantitative screening process and rigorous fundamental analysis, we seek to identify companies with these characteristics. Our "Private Equity in the Public Marketplace" approach integrates detailed financial modeling and competitive positioning analysis to uncover businesses with compelling reinvestment opportunities. This white paper explores the critical role of reinvestment opportunities in value creation, the metrics that illuminate a firm’s capacity to reinvest effectively, and how sustainable free cash flow acts as a catalyst for long-term growth. The Foundations of Intrinsic Value We believe the value of any asset is fundamentally tied to the present value of its future cash flow, discounted by a rate that reflects the risk and opportunity cost of capital. For equity investors, this translates into a focus on three interconnected pillars: Return on Invested Capital (ROIC): A measure of how efficiently a company allocates its capital to generate profits. Reinvestment Opportunities: The ability of a firm to deploy excess cash into high-return projects, whether through organic growth or inorganic strategies like mergers and acquisitions (M&A). Quality and Sustainability of Earnings: The reliability and resilience of a company’s earnings across economic cycles, providing the fuel for reinvestment. While our proprietary quantitative analysis helps us to systematically identify companies exhibiting these traits, the cornerstone of our process at Oliver Luxxe is detailed fundamental due diligence. This includes constructing discounted cash flow (DCF) models, performing comparable company analyses, and evaluating a firm’s competitive moat. By adopting a “private equity” mindset within the public markets, we aim to uncover businesses that not only generate strong returns but also possess the capacity to reinvest those returns at above-market rates. Reinvestment Opportunities: Organic and Inorganic Growth Reinvestment opportunities define a company’s ability to compound value over time. These opportunities fall into two categories: Organic Spending: Investments in existing operations, such as expanding production capacity, increasing R&D investments, enhancing product lines, or improving efficiency. Inorganic Spending: Accretive M&A that strengthens market position, diversifies revenue streams, or unlocks synergies. The success of reinvestment hinges on the availability of excess cash and management’s ability to deploy it at attractive rates of return. Consider a hypothetical example: A company generates $10.00 in revenue and $5.00 in net income (a 50% net margin). It converts 100% of its net income into free cash flow (FCF), yielding $5.00. Management reinvests $2.50 (a 50% reinvestment rate) at a ROIC of 30%, well above its WACC of 10%. This $2.50 grows to $3.00 in value, while the remaining $2.50 of FCF remains available for other uses, such as dividends, debt reduction, or further reinvestment. This "flywheel" effect, where high ROIC compounds through disciplined reinvestment, distinguishes exceptional businesses from average ones. However, the flywheel only spins if earnings are both high-quality and sustainable. The Oliver Luxxe Principles Our "Private Equity in the Public Marketplace" philosophy sets us apart by blending the rigor of private equity analysis with the liquidity and diversity of public markets. We prioritize companies with: High and sustainable ROIC relative to WACC. Robust reinvestment opportunities that may signal above-market returns. Durable earnings and free cash flow to fund those opportunities. By combining quantitative analysis with deep fundamental research, we seek to uncover undervalued businesses poised for long-term value creation. Our financial models project cash flows over multi-year horizons, while our competitive analysis seeks to ensure that reinvestment opportunities are defensible against industry rivals. Conclusion We believe reinvestment opportunities are a critical yet often overlooked driver of intrinsic value. Companies that can generate high returns on invested capital and are able to reinvest those returns at attractive rates can compound wealth beyond their peers. At Oliver Luxxe, our disciplined process seeks to identify these opportunities, leveraging both data-driven insights and hands-on analysis. In a market where short-term noise often overshadows long-term fundamentals, our focus on sustainable cash flows and reinvestment potential positions us—and our investors—for long-term success. Disclosures: All investment strategies have the potential for profit or loss. Different types of investments involve varying degrees of risk, and there can be no assurance that any specific investment will be suitable or profitable for a client's investment portfolio. This is not a recommendation nor an offer to sell (or solicitation of an offer to buy) securities in the United States or in any other jurisdiction.
January 30, 2025
Is the Glass Still Half Full? The S&P 500 rose 23% in 2024, following a 24% gain in 2023. As we enter 2025, we continue to expect solid economic growth, stronger US productivity, and favorable interest rate policies by global central banks. The US is expected to remain the global economic growth driver with expansion of the current business cycle, increased AI-related capital spending, solid employment growth, and prospects for increasing capital markets activities. Despite this favorable backdrop, there are a variety of factors that may affect US equity performance in 2025. First, we believe much of the robust earnings growth in 2023 and 2024 has been reflected in equity valuations, especially in the fastest-growing AI-related stocks (see below). Over the last two years, higher interest rates combined with the AI capex boom were a key driver of outsized performance by a narrow group of stocks. However, we think these elevated valuation levels leave little margin for error. We think it also places a constraint on the upside for outsized equity gains in 2025.